Get the blueprint for selecting the best Excel charts for data analysis and reporting 
Best Excel Charts for Data Analysis and Reporting
Get the FREE 40 page ebook:
Best Excel Charts For Data Analysis And Reporting
By Himanshu Sharma
Founder of OptimizeSmart.com 
WHAT'S INSIDE: My step-by-step blueprint for selecting the best Excel charts for data analysis and reporting (40 pages)

Table of Contents
1. The importance of data visualization
2. The anatomy of an Excel chart
3. Most common data types
4. When to use a clustered column chart
5. Breaking a clustered column chart
6. When to use combination charts
7. When to use stacked column chart
8. When to use a 100% stacked column chart
9. When to use a bar chart
10. When to use a line chart
11. When to use a number chart
12. When to use a gauge chart
13. When to use a scatter chart
14. When to use a pie chart
15. When to use a stacked area chart
16. When to use a histogram
17. When to use a Venn diagram
18. Charts to avoid for reporting purposes
19. Best practices for designing column and line charts
Where should I send your FREE ebook?
CUSTOM JAVASCRIPT / HTML
I agree to get the email updates and agree to the Privacy Policy and Terms of Use
About the Author 
  • Founder, OptimizeSmart.com
  • Over 15 years of experience in digital analytics and marketing
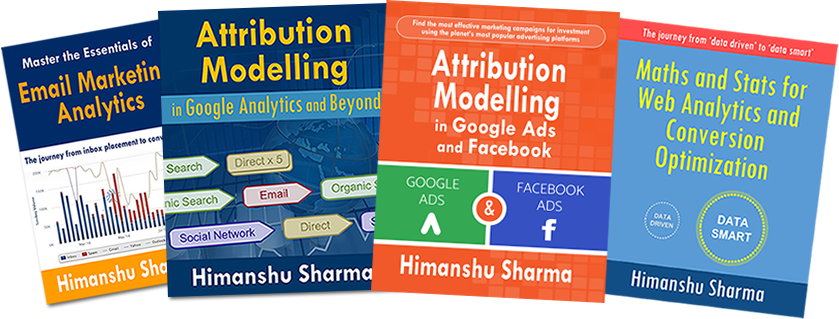
  • ​Author of four best-selling books on digital analytics and conversion optimization
  • ​Nominated for Digital Analytics Association Awards for Excellence
  • ​Runs one of the most popular blogs in the world on digital analytics
  • ​Consultant to countless small and big businesses over the decade
Copyright © 2024 OptimizeSmart.com  - All rights reserved | Privacy Policy and Terms of Use