Get the blueprint for visualzing and Analyzing data in Looker studio (formerly known as Google Data Studio)
Get the FREE 75 pages ebook:
Welcome To Looker Studio
By Himanshu Sharma
Founder of OptimizeSmart.com
Table of Contents
- Importance of data visualization in digital analytics
- How to access Looker Studio
- Building blocks of Looker Studio
-
Why you should work with Google Sheets
-
Why I use Google Sheets with Looker Studio, instead of Microsoft Excel
-
Introduction to data platforms
-
Introduction to connectors
-
Introduction to data sources
-
Data source connection
-
Data source fields
-
Types of data source fields
Where should I send your FREE ebook?
CUSTOM JAVASCRIPT / HTML
I agree to get the email updates and agree to the Privacy Policy and Terms of Use
About the Author


- Founder, OptimizeSmart.com
- Over 15 years of experience in digital analytics and marketing
-
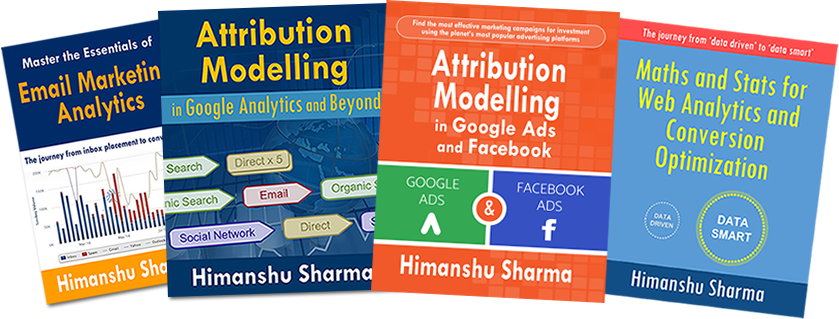
Author of four best-selling books on digital analytics and conversion optimization
-
Nominated for Digital Analytics Association Awards for Excellence
-
Runs one of the most popular blogs in the world on digital analytics
-
Consultant to countless small and big businesses over the decade


Copyright © 2024 OptimizeSmart.com - All rights reserved | Privacy Policy and Terms of Use
